Lesson Part 1
Sketching Graphs of Derivative Functions
Previously, we have seen that if \( f(x) \) is a polynomial of degree \( n \), then its derivative is one degree lower (i.e., \( n - 1 \)). (One exception to this is the case where \(f(x)\) is a constant function and so has degree \(n=0\).)
For example, if \( f(x) \) is a cubic polynomial (meaning that it has degree \(3\)), then its derivative function is quadratic (meaning that it has degree \(2\)). The derivative of the quadratic function is linear, so the second derivative function of a cubic polynomial is linear (degree \(1\)).
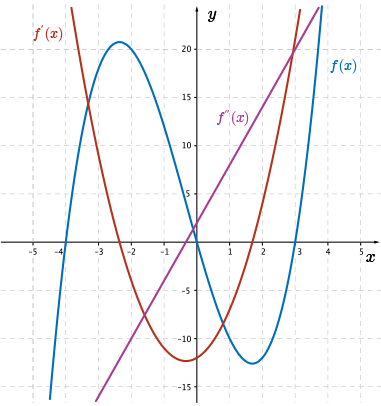
On the graph, we see this function (cubic), as well as the first derivative function (quadratic), and its corresponding second derivative function (a line).
Also, in our explorations of polynomials of higher order, we saw that as we move from the left side to the right side of the graph of a polynomial with degree \(n\geq 2\), we notice that the slope of the tangent line changes in steepness and over certain intervals the slope is positive or negative.
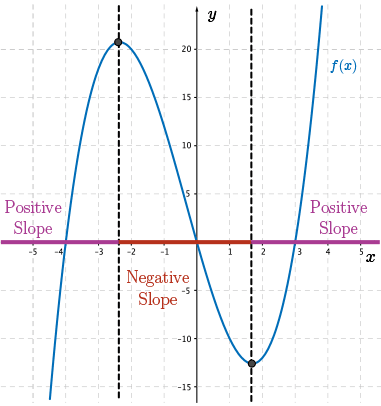
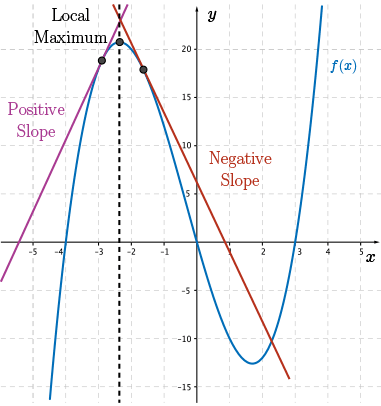
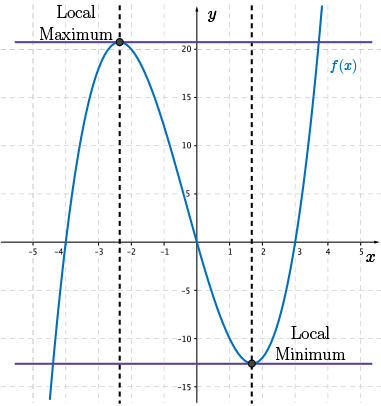
The slope of the tangent line changes from positive to negative as we pass through a local maximum. We can see this in the graph.
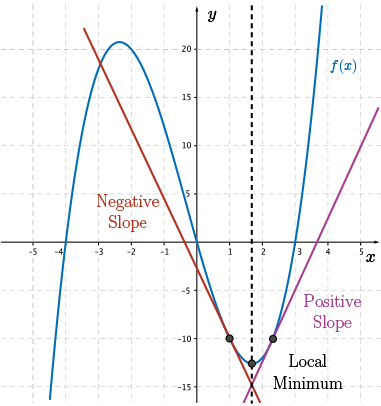
The slope of the tangent line changes from negative to positive as we pass through a local minimum.
At the local maximum or minimum, we see that the tangent line is horizontal and therefore, the value of its derivative is \(0\).
We can use all of this information to help us sketch the graph of the derivative function without finding the value of the derivative that all points within the domain of the first derivative function.
Lesson Part 2
Examples
Let's work through and example together and see how the graph of \(f'(x)\) and \(f''(x)\) can be made by just considering the graph of \(f(x)\).
Example 1
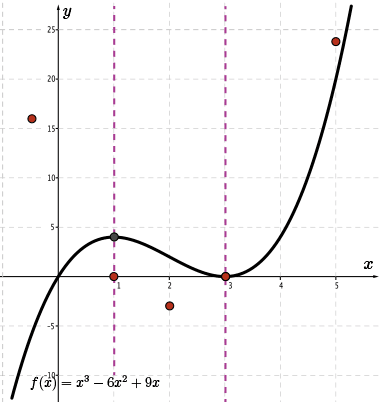
Using the graph of \(f(x)=x^3-6x^2+9x\), sketch the graph of \( f'(x) \) and \(\color{Mulberry} f''(x) \) on the same axes.
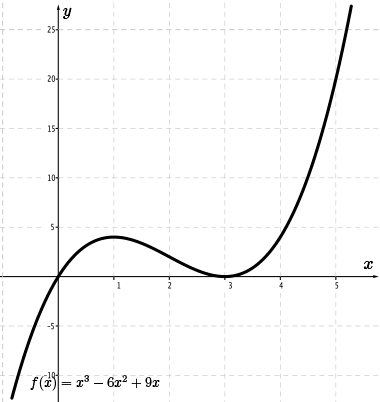
Solution
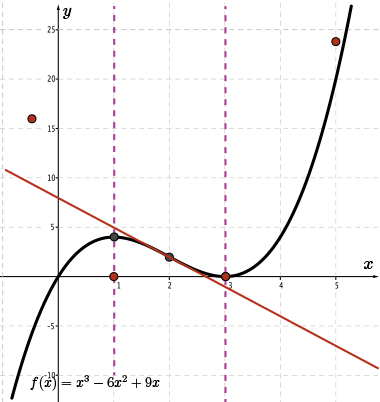
To sketch \(\color{BrickRed} f'(x)\), begin by identifying the position of the local maximum and local minimum. Through these points, draw vertical lines to separate the intervals where the slope of the tangent line is positive from the interval where the slope of the tangent line is negative.
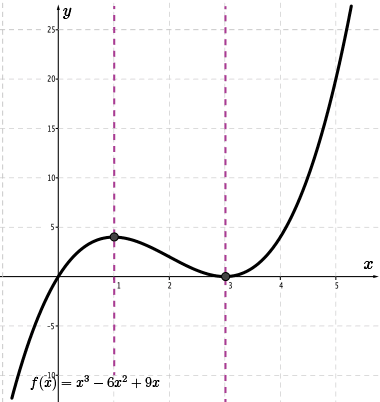
Since the slope of the tangent line is \(0\) at the local maximum and minimum, at these same \(x\)-coordinates the value of \({\color{BrickRed}f'(x)}=0\).
So, we know two points on the graph of \(\color{BrickRed} f'(x)\): \((1,0)\) and \((3,0)\).
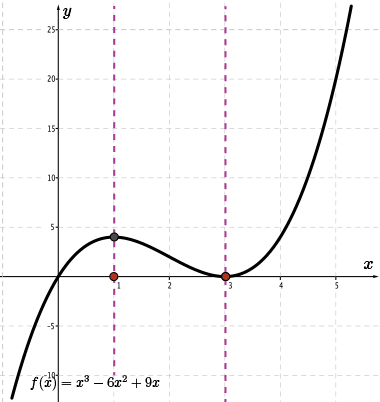
Notice how the positions of the local maximums and minimums of the graph of \(f(x)\) become the positions for the \(x\)-intercepts or zeros of the graph of \(\color{BrickRed} f'(x)\).
Given that \( f(x) \) is a cubic function, \( \color{BrickRed} f'(x) \) must be quadratic.
In the left-most interval, \(x\lt 1\), the slope of the tangent line at any point within this interval will always be positive meaning its points are above the \(x\)-axis.
Therefore, we know that \({\color{BrickRed} f'(x)}\gt 0\) within this interval.
Let's examine the tangent drawn to the point where \(x=-0.5\).
By estimating the rise and run, we find that the slope of the tangent at this point is approximately \(m=\frac{8}{0.5}=16\).
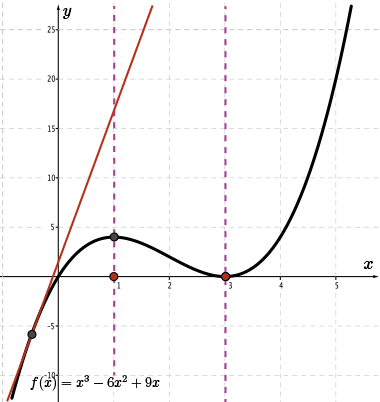
Therefore, we will use the point \((-0.5, 16)\) to help sketch the graph of \(\color{BrickRed} f'(x)\).
Similarly, in the right-most interval, \(x\gt 3\), the slope of the tangent line at any point within this interval will always be positive.
Therefore, we know that \({\color{BrickRed} f'(x)} \gt 0\) within this interval.
Let's examine the tangent drawn to the point where \(x=5\).
By estimating the rise and run, we find that the slope of the tangent at this point is approximately \(m=\frac{24}{1}=24\).
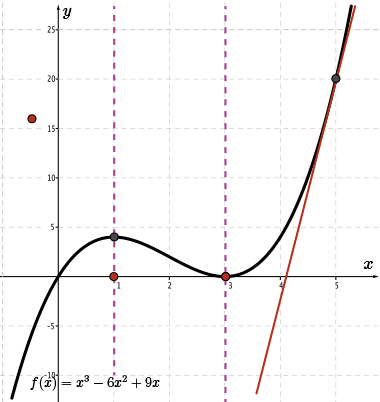
Therefore, we will use the point \((5, 24)\) to help sketch the graph of \(\color{BrickRed} f'(x)\).
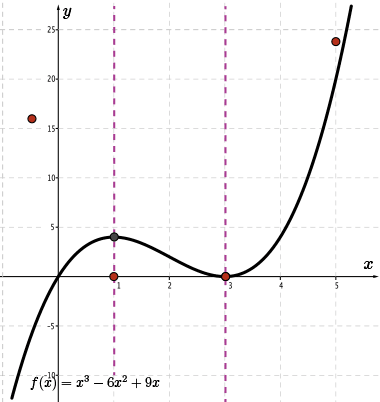
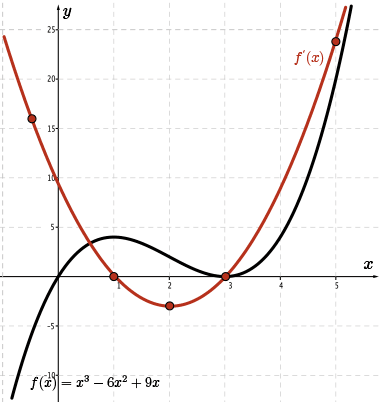
We now have four points on the graph of \(\color{BrickRed} f'(x)\): \((-0.5,16)\), \((1,0)\), \((3,0)\), and \((5,24)\). We are starting to see how this quadratic function will be formed.
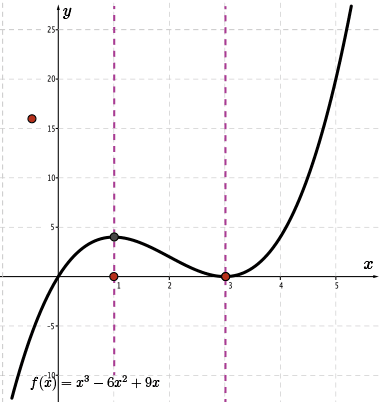
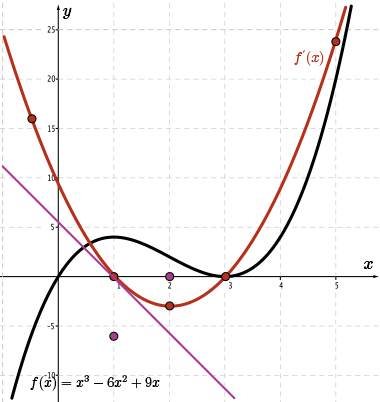
Within the middle interval, \(1 \lt x \lt 3\), the slope of the tangent to the curve will always be negative, meaning that \({\color{BrickRed} f'(x)}\lt 0\). In other words, all of the points on \(\color{BrickRed} f'(x)\) will be below the \(x\)-axis.
Since we know that \(\color{BrickRed} f'(x)\) is quadratic and we know the position of its two zeros, there is a minimum value that will occur on \(\color{BrickRed} f'(x)\) halfway between the two zeros. For this graph, the minimum value will occur at \(x=2\).
By estimating the rise and run, we find that the slope of the tangent at \(x=2\) is approximately \(m=\frac{-6}{2}=-3\).
Therefore, the point \((2,-3)\) is on the sketch of \(\color{BrickRed} f'(x)\).
We now have five points on the graph of \(\color{BrickRed} f'(x)\) and we know that this derivative function is quadratic.
We connect these five points with a smooth parabolic curve.
To sketch the graph of \(\color{Mulberry} f''(x) \), the same reasoning process is applied to the graph of \(\color{BrickRed} f'(x) \). That is, we will start with the graph of \(\color{BrickRed}f'(x)\).
Since \(\color{BrickRed} f'(x) \) is quadratic, \(\color{Mulberry} f''(x) \) is linear.
There is only one minimum: the vertex of the parabola. At this point, we know that the value of the derivative is \(0\).
Therefore, \({\color{Mulberry} f''(2)}=0\), and we know that the point \((2,0)\) is on the sketch of \(\color{Mulberry} f''(x)\).

To the left of the vertex, \(\color{BrickRed} f'(x) \) is decreasing and the tangent line has a negative slope, so we know that \({\color{Mulberry} f''(x)} \lt 0 \). In other words, all the points will be below the \(x\)-axis when \(x \lt 2\).
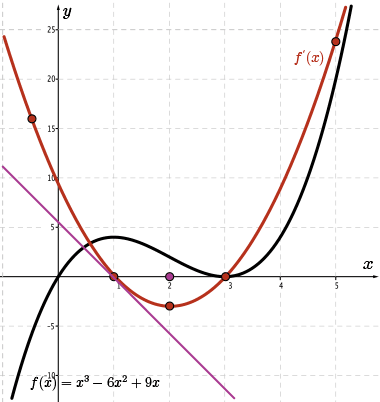
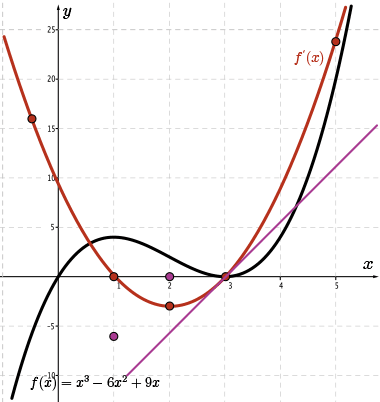
Let's calculate the slope of the tangent drawn to the sketch of \(\color{BrickRed} f'(x)\) at the point where \(x=1\).
By estimating the rise and run, we find that the slope of the tangent at \(x=1\) is approximately \(m=\frac{-6}{1}=-6\).
Therefore, the point \((1,-6)\) is on the sketch of \(\color{Mulberry} f''(x)\).
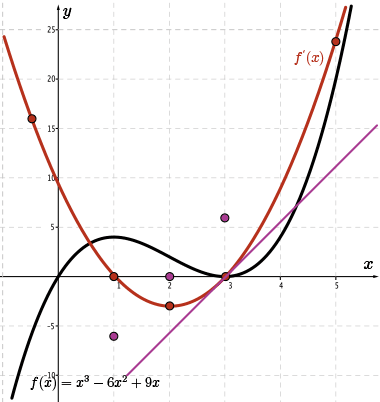
To the right of the vertex, \(\color{BrickRed} f'(x)\) is increasing and the tangent line has a positive slope. In other words, \({\color{Mulberry} f''(x)} \gt 0 \) meaning that all points to the graph of \(\color{Mulberry} f''(x)\) will be above the \(x\)-axis when \(x \gt 2\).
Since \(\color{BrickRed} f'(x)\) is quadratic and therefore symmetric about its axis, the slope of the tangent at \(x=1\) and at \(x=3\) will have the same magnitude (or steepness) but will be opposite in direction.
Since the slope of the tangent at \(x=1\) is \(-6\), the slope of the tangent at \(x=3\) is \(+6\).
Therefore, the point \((3,6)\) is on the sketch of \(\color{Mulberry} f''(x)\).
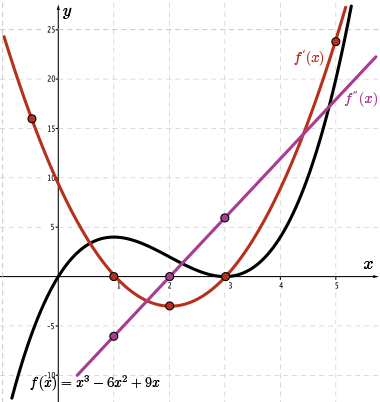
We have three points on the sketch of \(\color{Mulberry} f''(x)\) and we know that the second derivative function is linear.
Therefore, we connect these points to make the graph, as shown.
Quiz
See the first quiz in the side navigation.