In this section, we examine natural phenomena and engineered products that can be modelled by sinusoidal functions.
Ecology: Predator-Prey Interaction
In the wild, the population of two species may be related.
Predators
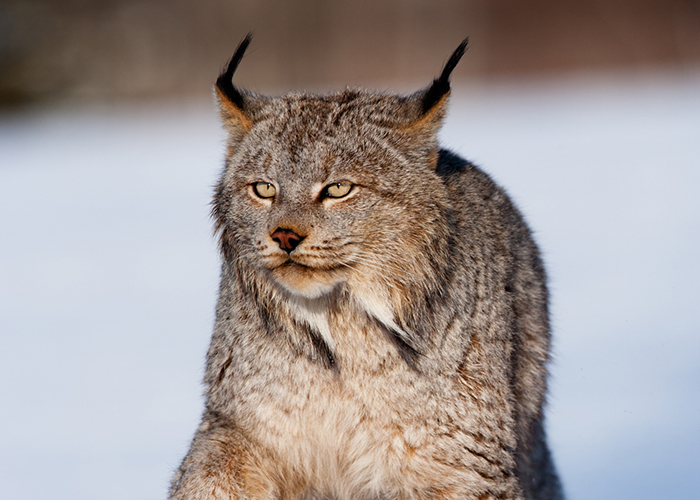
Source: Lynx - jimkruger/E+/Getty Images
A predator hunting for food influences the population of its prey.
- The more predators there are, the more likely the prey will be eaten.
- The fewer predators, the more likely the prey are to survive and reproduce.
Prey

Source: Hare - Akchamczuk/iStock/Getty Images
The prey also affects the population of the predator.
- The more prey, the more food available so the healthier the predators may become to catch prey and to reproduce.
- The fewer prey, the less likely predators are to find food and survive or reproduce.
Historical Fact
The earliest evidence of a predator-prey interaction cycle was found in the records of the Hudson's Bay Company, in what is now part of northern Canada. The graph shows the number of pelts of snowshoe hare (Lepus americanus) and Canadian lynx (Lynx canadensis) the company bought from trappers between 1845 and 1935.
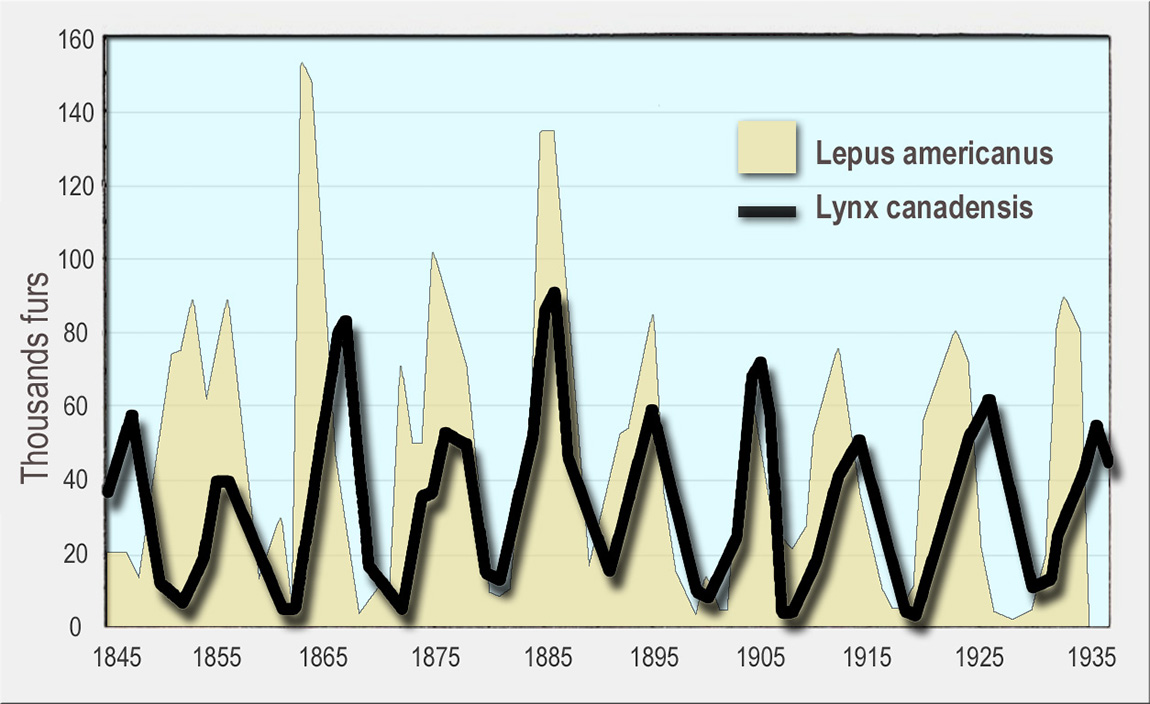
Source: Lamiot. (2015, November 16). [Graph of Pelt Sales of Canadian Lynx (Lynx canadensis) and Showshoe Hare (Lepus americanus) to Hudson's Bay Company, 1845-1935]. Retrieved from https://commons.wikimedia.org/w/index.php?curid=45036611 and licensed under CC BY-SA 4.0.
Note: This data does not represent the actual populations of the two species during this time. It may be an indicator of the populations, since it is likely that trappers were able to sell more pelts to the company when the animal populations were higher and sold fewer pelts when the populations were lower.
Note: The degree symbol is not used in many of the sinusoidal functions in this lesson as the context of the application may require different units.
Example 1
The island of Nohumans is inhabited only by hare and lynx. Scientists began studying the populations of the two species in the year 2000 and have made the following population models:
\[\text{Hare: }H\left(t\right)=20\sin\left(45t\right)+60\]\[\text{Lynx: }L\left(t\right)=4.5\sin\left(45\left(t-2\right)\right)+8.5 \]
where the population of each species, \(H(t)\) and \(L(t)\), is measured in thousands and time (\(t\)) is measured in years since the year 2000.
- What was the maximum hare population? In which years was the hare population at a maximum?
- In what years was the lynx population at a maximum?
- Why are the years found in parts a) and b) the same or different?
Solution — Part A
For a sinusoidal function of the form \(y=a\sin\left(b\left(x-h\right)\right)+k\), the maximum value of the function is \(k+\lvert a\rvert\).
From the model, \(H\left(t\right)=20\sin\left(45t\right)+60\), the maximum population was \(20~000+60~000=80~000\) hare.
To determine in which years the hare population was at a maximum, we need to solve for \(t\) in the equation:
\[\begin{align*} 20\sin\left(45t\right)+60&=80\\ 20\sin\left(45t\right)&=20\\ \sin\left(45t\right)&=1 \end{align*}\]
The base sine function reaches its maximum value of \(1\) when the input is \(90\) and repeats regularly since for all \(n\in\mathbb{Z}\), \(\sin\left(\left(90+360n\right)\right)=1\). Equating the inputs of the two equations, we get
\[\begin{align*} 45t&=90+360n\\ t&=2+8n \end{align*}\]
Therefore, the hare population was at a maximum in the years 2002, 2010, 2018, and every \(8\) years afterwards.
Solution — Part B
Method 1: Compare Period and Phase Shift
Comparing the hare model \(H\left(t\right)=20\sin\left(45t\right)+60\) and the lynx model \(L\left(t\right)=4.5\sin\left(45\left(t-2\right)\right)+8.5\), the two sine functions have the same \(b\) value but different \(h\) values. The period of both models is \(\dfrac{360}{45}=8\) years but the lynx model has a phase shift of \(2\) years to the right. This means that the lynx will reach their maximum population \(2\) years after the hare reach their maximum population, or in the years 2004, 2012, 2020, and every \(8\) years afterwards.
Method 2: Solve Equation
The maximum lynx population of \(4500+8500=13~000\) occurs when
\[\begin{align*} 4.5\sin\left(45\left(t-2\right)\right)+8.5&=13\\ 4.5\sin\left(45\left(t-2\right)\right)&=4.5\\ \sin\left(45\left(t-2\right)\right)&=1 \\ \text{Since }\sin\left(90+360n\right)&=1 \text{ for }n\in\mathbb{Z}\\ 45\left(t-2\right)&=90+360n\\ t-2&=2+8n \\ t&=4+8n \end{align*}\]
Therefore, the maximum lynx population occurs in the years 2004, 2012, 2020, and every \(8\) years afterwards.
Solution — Part C
Predator-prey interaction says that the more prey, the healthier the predators may become to catch prey and to reproduce. This implies that there is a delay between when the hare reach their maximum population and food is abundant for the lynx and when the lynx population reproduces to reach its maximum. From the models, this delay is \(2\) years.
Math In Action
Sinusoidal predator-prey models are simple examples of Lotka-Volterra equations that are used to describe the interactions of two species. Researchers apply these models to the following fields of study:
- Agriculture: weeds and insects (prey), herbicides and pesticides (predator)
- Medicine: disease (prey), drug (predator)
There is a body of thought that applying pesticides or giving patients medicine periodically rather than constantly may reduce the risk of treatment side effects, may reduce the risk of developing chemical resistance, and may reduce the cost of treatments. More research is needed to test these hypotheses.
Ocean Cycles
Did You Know?
The point on the Earth closest to the Moon is called the sublunar point.
The point on the Earth farthest from the Moon is called the antipodal point.
While our Earth is close to spherical, the world's oceans bulge in two areas, one around the sublunar point and the other around the antipodal point. These points are constantly moving as the Earth makes its daily rotation on its axis, and as the Moon rotates around the Earth every 28 days. It turns out that a particular point on Earth will be a sublunar point every 24 hours and 50 minutes.

Image not to scale.
Sources: Moon - Kativ/E+/Getty Images; Earth - loops7/iStock/Getty Images
Example 2
The depth of the water in a harbour, \(D\left(t\right)\), in metres, can be estimated by the function \(D\left(t\right)=4.3\cos\left(29t\right)+7\), where \(t\) is the number of hours after high tide.
- Identify the values of \(a\), \(b\), and \(k\) and interpret their meaning in this situation.
- If high tide occurred at 5:00 AM. Determine the depth of the water at
- 9:00 AM, and
- 2:45 PM.
Solution — Part A
From the equation \(D\left(t\right)=4.3\cos\left(29t\right)+7\), we know \(a=4.3\), \(b=29\), and \(k=7\).
Solution — Part B
- Since high tide occurred at 5:00 AM, 9:00 AM is \(4\) hours later.\[\begin{align*} D\left(4\right)&=4.3\cos\left(29\left(4\right)\right)+7\\ &=5.115\ldots \end{align*}\]
At 9:00 AM, the water was approximately \(5.1\) m deep.
- From 5:00 AM to 2:00 PM is \(9\) hours, so 2:45 PM is \(9 + 0.75 = 9.75\) hours after high tide.\[\begin{align*} D\left(9.75\right)&=4.3\cos\left(29\left(9.75\right)\right)+7\\ &=7.948\ldots \end{align*}\]
At 2:45 PM, the water was approximately \(7.9\) m deep.