From the equation \( y = -\cos{ \left[ \tfrac{1}{3} \left( x + \tfrac{5\pi}{6} \right) \right] } - 2 \), we can determine the characteristics of its graph:
- amplitude: \( a = -1 \) which corresponds to a reflection about the \( x \)-axis
- period: \( b = \tfrac{1}{3} \implies \dfrac{2\pi}{\tfrac{1}{3}} = 6\pi \)
- phase shift: \( h = -\tfrac{5\pi}{6} \) which corresponds to a translation left \( \tfrac{5\pi}{6} \) units
- vertical displacement: \( k = -2 \)
Using the vertical displacement, we determine the central horizontal axis to be \( y = -2 \). Using the amplitude, we determine the maximum value of \( y \) to be \( -2 + 1 = -1 \), and the minimum value to be \( -2 - 1 = -3 \).
Since \( (0, 1) \) is a maximum point on the base graph \( y = \cos(x) \), applying the transformations tell us that a minimum point of \( y = -\cos{ \left[ \tfrac{1}{3} \left( x + \tfrac{5\pi}{6} \right) \right] } - 2 \) will occur at \( \left( -\tfrac{5\pi}{6}, -3 \right) \) and another minimum point occurs one period later, at \( \left( -\tfrac{5\pi}{6} + 6\pi, -3 \right) = \left( \tfrac{31\pi}{6}, -3 \right) \).
A maximum point occurs when
\[\begin{align*} x &= -\tfrac{5\pi}{6} + \tfrac{1}{2}\text{(period)} \\ x &= -\tfrac{5\pi}{6} + 3\pi \\ x &= \tfrac{13\pi}{6} \end{align*}\]
which corresponds to the point \( \left(\tfrac{13\pi}{6}, -1\right) \).
The points which lie on the horizontal axis occur a \( \tfrac{1}{4} \) period and \( \tfrac{3}{4} \) period to the right of the leftmost endpoint:
\[\begin{align*} x &= -\tfrac{5\pi}{6} + \tfrac{1}{4}(\text{period}) \\ x &= -\tfrac{5\pi}{6} + \tfrac{1}{4}(6\pi) \\ x &= -\tfrac{5\pi}{6} + \tfrac{3}{2}\pi \\ x &= -\tfrac{5\pi}{6} + \tfrac{9\pi}{6} \\ x &= \tfrac{4\pi}{6} \\ x &= \tfrac{2\pi}{3} \\ \end{align*}\]which corresponds to the point \( \left( \tfrac{2\pi}{3}, -2 \right) \).
\[\begin{align*} x &= -\tfrac{5\pi}{6} + \tfrac{3}{4}(\text{period}) \\ x &= -\tfrac{5\pi}{6} + \tfrac{3}{4}(6\pi) \\ x &= -\tfrac{5\pi}{6} + \tfrac{9}{2}\pi \\ x &= -\tfrac{5\pi}{6} + \tfrac{27\pi}{6} \\ x &= \tfrac{22\pi}{6} \\ x &= \tfrac{11\pi}{3} \\ \end{align*}\]which corresponds to the point \( \left( \tfrac{11\pi}{3}, -2 \right) \).
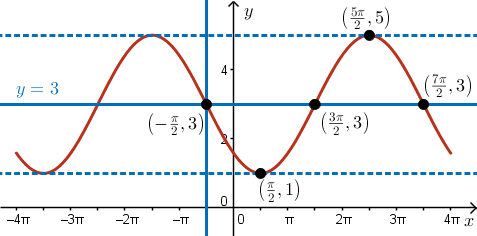
Putting these all together, we obtain the following sketch: 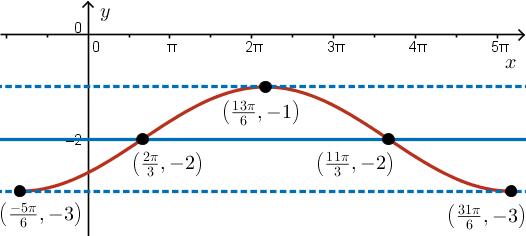 From the equation \( y = -2\sin{ \left( \tfrac{x}{2} + \tfrac{\pi}{4} \right) } + 3 = -2\sin{ \left[ \tfrac{1}{2} \left( x + \tfrac{\pi}{2} \right) \right] } + 3 \), we can determine the characteristics of its graph:
- amplitude: \( a = -2 \) which corresponds to a vertical stretch by a factor of \( 2 \) and a reflection about the \( x \)-axis
- period: \( b = \tfrac{1}{2} \) which corresponds to a period of \( \dfrac{2\pi}{\tfrac{1}{2}} = 4\pi \)
- phase shift: \( h = -\tfrac{\pi}{2} \) which corresponds to a translation left \( \tfrac{\pi}{2} \) units
- vertical displacement: \( k = 3 \) which corresponds to a central horizontal axis of \( y = 3 \)
Using the amplitude and the central horizontal axis, we determine the maximum value of \( y \) to be \( 3 + 2 = 5 \), and the minimum value to be \( 3 - 2 = 1 \).
On the base graph of \( y = \sin(x) \), \( (0, 0) \) is a point on its central horizontal axis that lies within the domain \( -4\pi \leq x \leq 4\pi \). On the transformed graph, this corresponds to the point \( \left( -\tfrac{\pi}{2}, 3 \right) \).
A minimum point of \( y = -2\sin{ \left[ \tfrac{1}{2} \left( x + \tfrac{\pi}{2} \right) \right] } + 3 \) occurs a quarter period to the right of \( \left( -\tfrac{\pi}{2}, 3 \right) \), at \( \left( -\tfrac{\pi}{2} + \tfrac{1}{4}(4\pi), 1 \right) = \left( \tfrac{\pi}{2}, 1 \right) \).
A maximum point of \( y = -2\sin{ \left[ \tfrac{1}{2} \left( x + \tfrac{\pi}{2} \right) \right] } + 3 \) occurs a half period to the right of the minimum point, \( \left( \tfrac{\pi}{2}, 1 \right) \), at \( \left( \tfrac{\pi}{2} + \pi, 1 + 4 \right) = \left( \tfrac{5\pi}{2}, 5 \right) \).
Two other points on the central horizontal axis will occur a half period and a full period to the right of \( \left( -\tfrac{\pi}{2}, 3 \right) \), at
\[ \left( -\tfrac{\pi}{2} + \tfrac{1}{2}(4\pi), 3 \right) = \left( \tfrac{3\pi}{2}, 3 \right) \] and\[ \left( -\tfrac{\pi}{2} + 4\pi, 3 \right) = \left( \tfrac{7\pi}{2}, 3 \right) \]
Labelling these points, we obtain the full five-point sketch: