Solving Polynomial Equations and Inequalities Using Technology Alternative Format
Lesson
Introduction
Polynomial functions can be used to model many real-world situations from revenue and cost formulas in business, to population predictions in science, to bridge designs in engineering.
It is very unlikely, when working with the polynomial functions in these circumstances, that the equations can be solved easily using the factoring techniques taught in this unit.
Although there are other algebraic methods for solving these polynomial equations, such as the Bisection method or Newton's method (which requires calculus), solutions to these equations can be determined efficiently using graphing technology.
You may wish to research the algebraic approaches mentioned. However, study of these concepts are covered in post-secondary mathematics.
In this module, we will demonstrate the use of graphing technology, by utilizing the Maple worksheet provided, to solve a real-life problem involving polynomial equations and inequalities.
Example
Consider the following problem.
Problem
The annual revenue, for a small start up company, is modeled by the function
\[R(t)=t^3-10.5t^2+30t+14, t \geq 0\]
where \(R\) is the revenue in tens of thousands and \(t\) is the number of years since the company was first formed in \(2000\).
a. What was the revenue of the company the year it was established?
b. In which year, or years, will the annual revenue of the company be \( $350\,000\)?
c. The company chose to expand when the annual revenue was greater than \($500\,000\). In which year did this expansion occur?
d. The annual cost to run the company can be modeled by \(C(t)=-0.85t+35.8\), where \(C\) is the cost in tens of thousands and \(t\) is the time in years since \(2000\). During which year, or years, was the company not making a profit?
e. Are there any real-world limitations to this model?
\[R(t)=t^3-10.5t^2+30t+14,\ t \geq 0\]
Solution — Part a
a. What was the revenue of the company the year it was established?
The company was founded in \(2000\), so \( t = 0 \).
No technology is necessary. We simply substitute \( t = 0 \) into the revenue formula.
\[ \begin{align*} R(0) &= (0)^3-10.5(0)^2+30(0)+14 \\ &=14 \end{align*} \]
Therefore, the revenue generated in \(2000\) was \($140\,000\) (since \( R \) is revenue in tens of thousands, revenue \(= R \times 10000 \)).
Solution — Part b
b. In which year, or years, will the annual revenue of the company be \($350\,000\)?
We need to find \(t\), when \(R(t)=35\).
(Remember \(R\) is the revenue in tens of thousands, so \(R=350000 \div 10000\).)
We need to solve
\[35=t^3-10.5t^2+30t+14\]
Using graphing technology, we can do this one of two ways.
Solution Method 1
In this method, we can graph \(f(x)=x^3-10.5x^2+30x+14\) and \(g(x)=35\) and find the points of intersection of the two graphs, since we need to determine when the revenue is \(350 000\).
The two functions have been entered into the Maple worksheet.
By selecting a point of intersection, its coordinates will appear on the screen.
We can see here that the revenue is \($350\,000\) (i.e., \(R=35\)) when \(x=1.04\).
By selecting the other two points of intersection, we find \(x=3.24\), and \(x=6.22\).
Therefore, the revenue of the company will be \($350\,000\) at some point in the years \(2001\), \(2003\), and \(2006\).
Solution Method 2
To solve \(35=t^3-10.5t^2+30t+14\), we rearrange the equation.
\[0=t^3-10.5t^2+30t-21\]
We can now graph
\[f(x)=x^3-10.5x^2+30x-21\]
using the Maple worksheet and find the \(x\)-intercepts, which are equivalent to the values of \(t\) that satisfy the original equation.
We enter the function
\[f(x)=x^3-10.5x^2+30x-21\]
into the Maple worksheet.
By selecting an \(x\)-intercept on the graph, its coordinates will be identified (note the software assumes \(g(x)=0\)).
Again, \(x=1.04, 3.24\), and \(6.22\).
Therefore, the revenue of the company will be \($350\,000\) in the years \(2001\), \(2003\), and \(2006\).
You can see by the diagram shown here that the solution we obtain is the same as that found in method one.
Solution — Part c
c. The company chose to expand when the annual revenue was greater than \($500\,000\). In which year did this expansion occur?
We need to determine when \(R(t) \gt 50\).
Replacing \(R(t)\) with \(f(x)\), we will graph \(f(x)=t^3-10.5t^2+30t+14\) and \(g(x)=50\) and determine when \(f(x) \gt g(x)\).
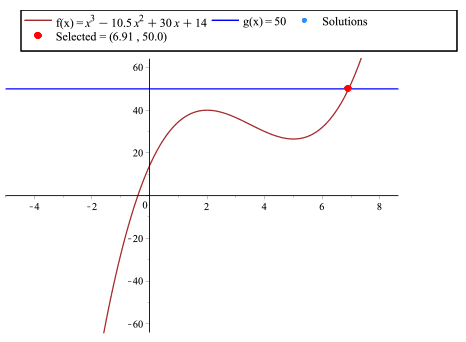
In the graph, \( f(x) = g(x) \) when \( x = 6.91 \).
We also note that the revenue function is above the graph of \(g(x)\), the linear function, when \(x \gt 6.91\).
This can be interpreted to mean that the company will choose to expand near the end of \(2006\).
Another approach would be to rearrange the equation algebraically
\[ \begin{align*} t^3 - 10.5t^2 + 30t + 14 &\gt 50 \\ t^3 - 10.5t^2 + 30t - 36 &\gt 0 \end{align*} \]
We can then define the function \(f(x)\) to represent the polynomial on the left side of the equation
\[ f(x) = x^3 - 10.5x^2 + 30x - 36 \]
and determine when \( f(x) \gt 0 \) (above the \( x \)-axis).

Using either method, we will obtain the same answer.
Solution — Part d
d. The annual cost to run the company can be modeled by \(C(t)=-0.85t+35.8\), where \(C\) is the cost in tens of thousands and \(t\) is the time in years since \(2000\). During which year, or years, was the company not making a profit?
\[ \begin{align*} \text{Profit} &= \text{Revenue} - \text{Cost} \\ P(t) &= (t^3 - 10.5t^2 + 30t + 14) - (-0.85t + 35.8) \\ P(t) &= t^3 - 10.5t^2 + 30.85t - 21.8 \end{align*} \]
We need to determine when \( P(t) \gt 0 \), by graphing the profit function
\[ f(x) = x^3 - 10.5x^2 + 30.85x - 21.8 \]
and determining when \( f(x) \gt 0 \).
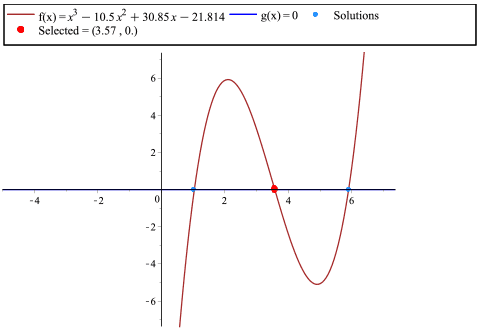
The \( x \)-intercepts occur at \( x = 1.04\), \(3.57 \), and \( 5.89 \).
The profit will be less than \(0\) when the function itself is below the \(x\)-axis.
This can be interpreted to mean that the company was not making any profit from \(2000\) to \(2001\), and between July \(2003\) and November \(2005\).
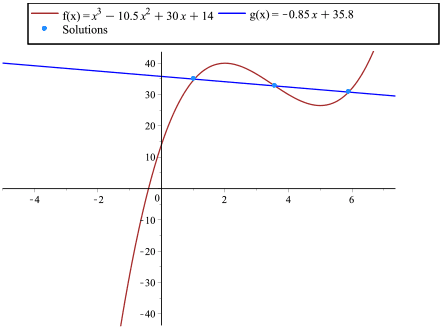
Another approach would be to graph the revenue and cost functions, \( f(x) = x^3 - 10.5x^2 + 30x + 14 \) and \( g(x) = -0.85x + 35.8 \), and determine when \( f(x) \gt g(x) \).
Solution — Part e
e. Are there any real-world limitations to this model?
Generally speaking, these types of models are used to make predictions and come with limitations.
The equations may model the revenue and/or costs for the company for a limited period of time.
With this equation, as time \((t)\) increases in value, the revenue and profit will also increase without bound, which is highly unlikely.
Also, cost decreases over time and will be approximately equal to zero around \(2042\). This will not happen in a real-world situation.
These are only a few limitations. You may possibly think of more.
In this module, we have demonstrated how the Maple worksheet provided can be used to solve problems involving polynomials. Other tools or devices, such as graphing software, or calculators with graphing capabilities, or computer algebra systems, can be used in similar ways to assist us in solving more difficult polynomial equations and inequalities.
Check Your Understanding A and B
These questions are not included in the Alternative Format, but can be accessed in the Review section of the side navigation.